Two important results today in supernova cosmology: a consistent set of host-galaxy stellar masses (Union3.1 led by Taylor Hoyt) and a new Bayesian model that solves for two SN Ia subclasses (UNITY1.8 by me). Both tackle one of our biggest challenges: astrophysical systematics.
Supernova cosmology uses standardizable candles (type Ia SNe, in this case) to measure distances in the universe. After standardization using their light curves, these SNe have about the same luminosity, so their apparent brightnesses tell us their distances.
The redshift of SN (or host galaxy) light gives the amount the universe has expanded since the SN exploded. Looking back over billions of years, the distance-versus-redshift relation traces the expansion of the universe, telling us about its history, composition, and fate.
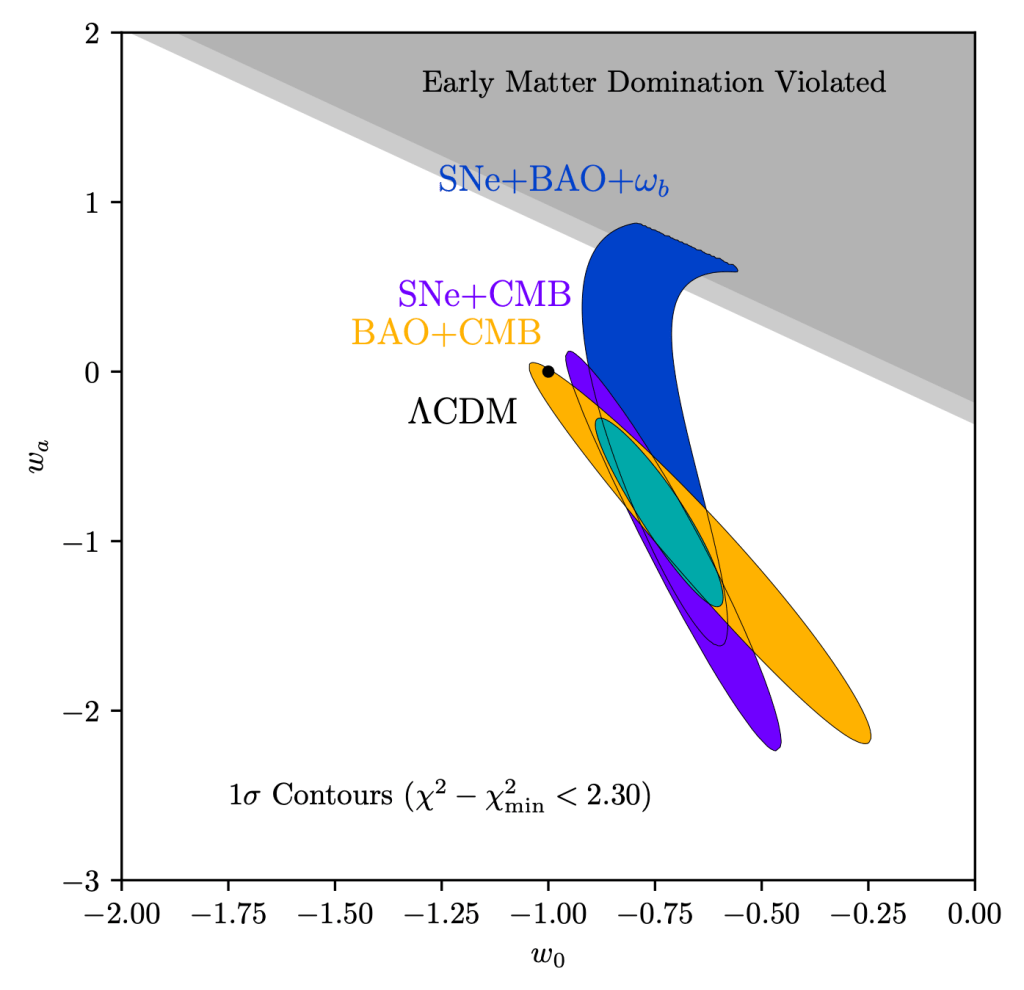
In the 1990’s, SNe Ia provided strong evidence that the expansion of the universe is accelerating! Cosmologists named source of the acceleration, “dark energy.” It could be a cosmological constant but recent results hint at change in time, which would indicate new physics!
Many of the key challenges in supernova cosmology rely on trying to ensure that distant SNe and nearby SNe are standardized to the same luminosity. Sometimes, that’s under our control, like measuring the linearity of our cameras so that bright and faint sources can be compared.
But some of the most worrying effects are outside our control. How do we know that SNe billions of years ago had the same luminosity as SNe today? A trick that started to be used for the first results in the 90’s was to look at old and young galaxies at similar redshifts.
There are a range of galaxy ages at every redshift, so we can measure both host-galaxy correlations and cosmology. The first tests passed, so the 1990’s discovery of the accelerated expansion of the universe was judged to be reliable.
But around 2010, the SN samples were large enough (hundreds of SNe) to see that this test fails: the luminosity of SNe hosted by high-stellar-mass (older, on average) galaxies was about 8% higher than the luminosity of SNe hosted by low-stellar-mass galaxies. 8% is huge!
This posed a big problem! The first solution (2010’s) was to regress on host-galaxy stellar mass. This requires consistently measured host-galaxy masses across cosmic time, and Taylor’s paper is a major contribution here.
But 8% is a lot to remove. How can we talk about doing SN cosmology with accuracy of 1% (today’s surveys) or better (the next generation of surveys) if we’re removing 8%? Galaxies are complicated! If we haven’t regressed on the right host-galaxy parameters, we could be way off.
The next step was (Brout and Scolnic 2021) recognizing that the color standardization for reddened SNe depends on host-galaxy stellar mass, and correcting for this removes a lot of the luminosity difference (a bit more than half, according to our results today).
But the UNITY1.8 paper today is another big step forward: there’s been evidence for (at least) two types of normal SNe Ia, with the fractions of the types varying with host galaxy and redshift. One type is younger and has slower-evolving light curves, the other, the opposite.
It hasn’t been completely clear if they are two ends of the same continuum. For example, double-peaked nebular iron emission only in some SNe could be a viewing-angle effect or indicate (at least) two different classes.
UNITY1.8 takes the suggestion that they are different classes seriously. It does cosmology modeling two populations with different light-curve-shape and color distributions and different standardizations. This has been done for the Hubble constant, but not for dark energy.
Punchlines: The luminosity difference with host-galaxy stellar mass is now consistent with zero (0.2% +- 1.2%), robust across different model variations! We still regress this out, just in case. The evidence for time-evolving dark energy decreases a bit (to about 3 sigma).
On to the next generation of surveys (the Vera C. Rubin Observatory, and the Nancy Grace Roman Space Telescope) and sub-percent precision!